At least for basic tasks it performs well as far as I can tell.
For those seeking pretty chromatograms, OpenChrom can be used in conjunction with R. Open a plot in OpenChrom, export it to a csv file and then plot the data using R.
A script for plotting two overlapped chromatograms in R is below:
filename = "Dodecane-Neat"
filename2 = "Dodecane-Stressed"
PlotTitle = "Dodecane Neat Chromatogram - Pre and Post Test"

infilename = paste0("./",paste(filename,"csv",sep="."))
infilename2 = paste0("./",paste(filename2,"csv",sep="."))
outfilename = paste(filename,"pdf",sep="-rect.")

## Read Data -> File is called 14mielczarek11.csv
undiluted <- read.table(infilename, sep=";", header=TRUE, nrows=10000)
undiluted2 <- read.table(infilename2, sep=";", header=TRUE, nrows=10000)
## Work out Total Peak (want the Chromatogram, not the mass spec)
undiluted$peaks <- rowSums( undiluted[,3:404] )
undiluted2$peaks <- rowSums( undiluted2[,3:404] )

GCxx <- c(undiluted$RT.milliseconds./1000/60, rev(undiluted$RT.milliseconds./1000/60))
GCyy <- c(rep(0, nrow(undiluted)), rev(undiluted$peaks)/max(undiluted$peaks))
GCxx2 <- c(undiluted2$RT.milliseconds./1000/60, rev(undiluted2$RT.milliseconds./1000/60))
GCyy2 <- c(rep(0, nrow(undiluted2)), rev(undiluted2$peaks)/max(undiluted2$peaks))

library(survival)
library(Hmisc)

# A4 is 8.27 × 11.7
pdf(outfilename, height=5, width=8)
par(mar=c(5,5,3,2))

plot("",
tck=-0.02,lab=c(10,10,4),las=1,
xaxs="i",xlab="Time (min)",
xlim=c(0,15),
yaxs="i",ylab="Detector Count Fraction",
ylim=c(0,0.15)
)

polygon(GCxx2+0.017, GCyy2, col= rgb(0,0,1,0.5), border=NA) #Blue - Shift the blue ever so slightly to properly overlap
polygon(GCxx, GCyy, col= rgb(1,1,1,1), border=NA) # White (so we don't get violet)
polygon(GCxx, GCyy, col= rgb(1,0,0,0.6), border=NA) # Red

lines(undiluted2$RT.milliseconds./1000/60+0.017,undiluted2$peaks/max(undiluted2$peaks),
type="l",col=4,lwd="0.05",lty=1) #Blue
lines(undiluted$RT.milliseconds./1000/60,undiluted$peaks/max(undiluted$peaks),
type="l",col=2,lwd="0.05",lty=1) # Red

title(PlotTitle)
minor.tick(nx=5, ny=5, tick.ratio=0.3)

dev.off()
At least for basic tasks it performs well as far as I can tell.
For those seeking pretty chromatograms, OpenChrom can be used in conjunction with R. Open a plot in OpenChrom, export it to a csv file and then plot the data using R.
A script for plotting two overlapped chromatograms in R is below:
filename = "Dodecane-Neat"filename2 = "Dodecane-Stressed"PlotTitle = "Dodecane Neat Chromatogram - Pre and Post Test"infilename = paste0("./",paste(filename,"csv",sep="."))infilename2 = paste0("./",paste(filename2,"csv",sep="."))outfilename = paste(filename,"pdf",sep="-rect.")## Read Data -> File is called 14mielczarek11.csvundiluted <- read.table(infilename, sep=";", header=TRUE, nrows=10000)undiluted2 <- read.table(infilename2, sep=";", header=TRUE, nrows=10000)## Work out Total Peak (want the Chromatogram, not the mass spec)undiluted$peaks <- rowSums( undiluted[,3:404] )undiluted2$peaks <- rowSums( undiluted2[,3:404] )GCxx <- c(undiluted$RT.milliseconds./1000/60, rev(undiluted$RT.milliseconds./1000/60))GCyy <- c(rep(0, nrow(undiluted)), rev(undiluted$peaks)/max(undiluted$peaks))GCxx2 <- c(undiluted2$RT.milliseconds./1000/60, rev(undiluted2$RT.milliseconds./1000/60))GCyy2 <- c(rep(0, nrow(undiluted2)), rev(undiluted2$peaks)/max(undiluted2$peaks))library(survival)library(Hmisc)# A4 is 8.27 × 11.7 pdf(outfilename, height=5, width=8)par(mar=c(5,5,3,2))plot("",tck=-0.02,lab=c(10,10,4),las=1,xaxs="i",xlab="Time (min)",xlim=c(0,15),yaxs="i",ylab="Detector Count Fraction",ylim=c(0,0.15))polygon(GCxx2+0.017, GCyy2, col= rgb(0,0,1,0.5), border=NA) #Blue - Shift the blue ever so slightly to properly overlappolygon(GCxx, GCyy, col= rgb(1,1,1,1), border=NA) # White (so we don't get violet)polygon(GCxx, GCyy, col= rgb(1,0,0,0.6), border=NA) # Redlines(undiluted2$RT.milliseconds./1000/60+0.017,undiluted2$peaks/max(undiluted2$peaks),type="l",col=4,lwd="0.05",lty=1) #Bluelines(undiluted$RT.milliseconds./1000/60,undiluted$peaks/max(undiluted$peaks),type="l",col=2,lwd="0.05",lty=1) # Redtitle(PlotTitle)minor.tick(nx=5, ny=5, tick.ratio=0.3)dev.off()
@Molx Yes, people who want to plot their own would need to adjust the limits of course - I would have thought that is obvious? Maybe one could write an automatic function - however if this is possible I wouldnt know how to do this.More
R is a great suggestion, though I hardly believe this code will be useful to anyone else the way it is. With this amount of detail for limits, data transformation and such, its probably better to plot the bare chromatogram x/y values with lines and let people do the adjustments themselves.More




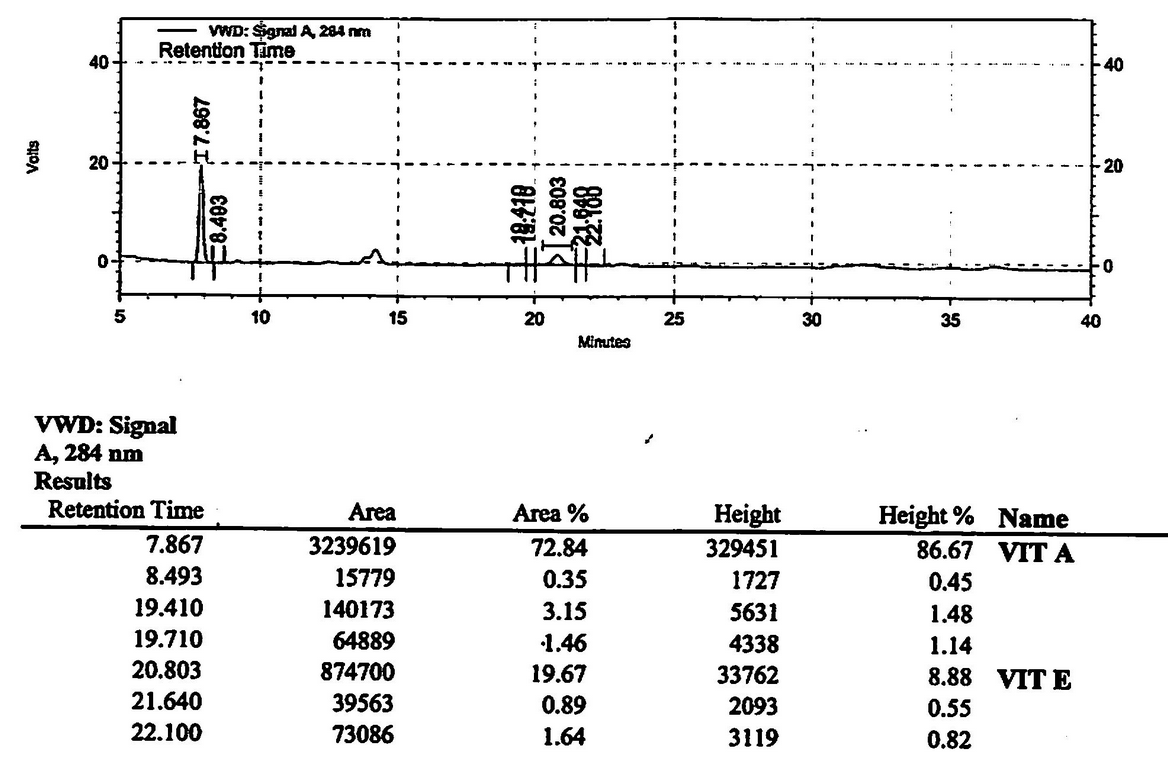
One software that I have come across and used is OpenChrom https://www.openchrom.net/
At least for basic tasks it performs well as far as I can tell.
For those seeking pretty chromatograms, OpenChrom can be used in conjunction with R. Open a plot in OpenChrom, export it to a csv file and then plot the data using R.
A script for plotting two overlapped chromatograms in R is below:
And the results:
One software that I have come across and used is OpenChrom https://www.openchrom.net/
At least for basic tasks it performs well as far as I can tell.
For those seeking pretty chromatograms, OpenChrom can be used in conjunction with R. Open a plot in OpenChrom, export it to a csv file and then plot the data using R.
A script for plotting two overlapped chromatograms in R is below:
And the results:
More
VOTE
VOTE
VOTE