Home >
Community >
How can I calculate IC50 in DPPH test?
Upvote
30
Downvote
+ Dpph
+ Antioxidants
+ Ic50
Posted by
Marc Hellé
How can I calculate IC50 in DPPH test?
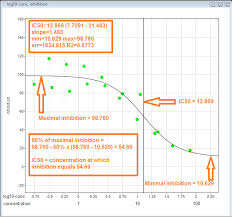
Dear Dr Rufayda Izzeldin, Here's the method: If you use are using GraphPad prism: From the data table, click Analyze, choose nonlinear regression, and choose the panel of equations: Dose-Response -- Special, X is log(concentration). Then choose "Absolute IC50, X is log(concentration)". You must enter a value for the parameter "Baseline" on the Constrain tab of the analysis parameters dialog. If you are using Excell: insert a "scatter plot," and set the Y-axis to "logarithmic." It should be approximately linear over some range. Select "add trend line" and pick "exponential." Then display equation and you've got it. Best wishes, Sabri
Dear Dr Rufayda Izzeldin, Here's the method: If you use are using GraphPad prism: From the data table, click Analyze, choose nonlinear regression, and choose the panel of equations: Dose-Response -- Special, X is log(concentration). Then choose "Absolute IC50, X is log(concentration)". You must enter a value for the parameter "Baseline" on the Constrain tab of the analysis parameters dialog. If you are using Excell: insert a "scatter plot," and set the Y-axis to "logarithmic." It should be approximately linear over some range. Select "add trend line" and pick "exponential." Then display equation and you've got it. Best wishes, Sabri
The simplest estimate of IC50 is to plot x(concentration of extract),y (inhibition of DPPH (%)and fit the data with a straight line (linear regression). IC50 value is then estimated using the fitted line, i.e., Y = a * X + b, IC50 = (50 - b)/a.
The simplest estimate of IC50 is to plot x(concentration of extract),y (inhibition of DPPH (%)and fit the data with a straight line (linear regression). IC50 value is then estimated using the fitted line, i.e., Y = a * X + b, IC50 = (50 - b)/a.
Plot a scatter plot graph at different concentration in excel and and fit the data with a straight line and calculate the value with y=m*x+c where y= % scavenging and x= concentration. Use y=50 and identify the concentration.
Plot a scatter plot graph at different concentration in excel and and fit the data with a straight line and calculate the value with y=m*x+c where y= % scavenging and x= concentration. Use y=50 and identify the concentration.



Dear Dr Rufayda Izzeldin,
Here's the method:
If you use are using GraphPad prism:
From the data table, click Analyze, choose nonlinear regression, and choose the panel of equations: Dose-Response -- Special, X is log(concentration). Then choose "Absolute IC50, X is log(concentration)". You must enter a value for the parameter "Baseline" on the Constrain tab of the analysis parameters dialog.
If you are using Excell:
insert a "scatter plot," and set the Y-axis to "logarithmic." It should be approximately linear over some range. Select "add trend line" and pick "exponential." Then display equation and you've got it.
Best wishes,
Sabri
Dear Dr Rufayda Izzeldin,
Here's the method:
If you use are using GraphPad prism:
From the data table, click Analyze, choose nonlinear regression, and choose the panel of equations: Dose-Response -- Special, X is log(concentration). Then choose "Absolute IC50, X is log(concentration)". You must enter a value for the parameter "Baseline" on the Constrain tab of the analysis parameters dialog.
If you are using Excell:
insert a "scatter plot," and set the Y-axis to "logarithmic." It should be approximately linear over some range. Select "add trend line" and pick "exponential." Then display equation and you've got it.
Best wishes,
Sabri
More
VOTE
The simplest estimate of IC50 is to plot x(concentration of extract),y (inhibition of DPPH (%)and fit the data with a straight line (linear regression). IC50 value is then estimated using the fitted line, i.e., Y = a * X + b, IC50 = (50 - b)/a.
The simplest estimate of IC50 is to plot x(concentration of extract),y (inhibition of DPPH (%)and fit the data with a straight line (linear regression). IC50 value is then estimated using the fitted line, i.e., Y = a * X + b, IC50 = (50 - b)/a.
More
VOTE
Plot a scatter plot graph at different concentration in excel and and fit the data with a straight line and calculate the value with y=m*x+c where y= % scavenging and x= concentration. Use y=50 and identify the concentration.
Plot a scatter plot graph at different concentration in excel and and fit the data with a straight line and calculate the value with y=m*x+c where y= % scavenging and x= concentration. Use y=50 and identify the concentration.
More
VOTE