Home >
Community >
umap and Louvain clustering on normalized data
Upvote
26
Downvote
+ Bioinformatics
Posted by
Ken Saladin
umap and Louvain clustering on normalized data
If the data are single-cell RNA seq, after normalization can we do
UMAP and Louvain clustering ?
Typically people run PCA, UMAP and Louvain clustering on the normalised and log-transformed expression counts (but do marker gene and differential expression analysis on the non-normalised values). However, this remains controversial. I recommend reading "Current best practices in single‐cell RNA‐seq analysis: a tutorial"- it's a bit outdated, but still a good reference.
By adequate I mean the clusters are the same but some are split into
two, which makes sens looking at other results (like transcription
factor analysis).
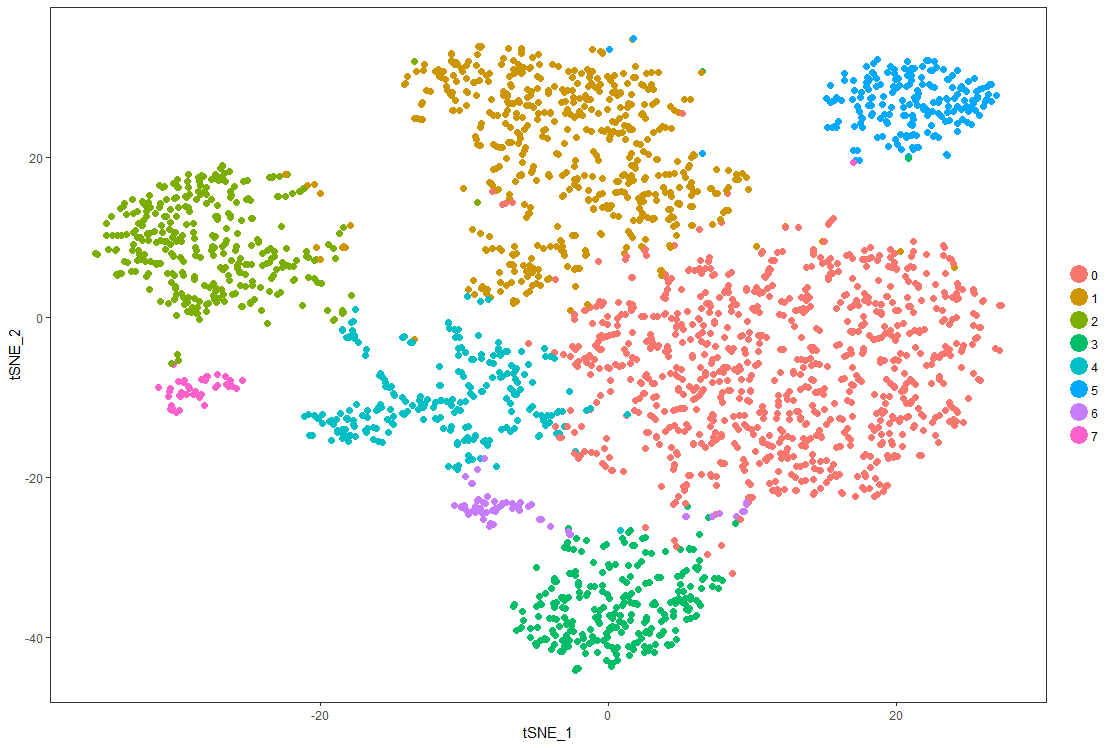
The number of (or size of) clusters should not be used to interpret how good the clustering methodology is, since it is generally dependant on the input parameters, e.g. a higher resolution parameter leads to more clusters. Instead, display the clusters on the UMAP and see if they are continuous 'visually' and check what genes are differentially expressed between clusters and see if they make sense 'biologically'.
If the data are single-cell RNA seq, after normalization can we do UMAP and Louvain clustering ?
Typically people run PCA, UMAP and Louvain clustering on the normalised and log-transformed expression counts (but do marker gene and differential expression analysis on the non-normalised values). However, this remains controversial. I recommend reading "Current best practices in single‐cell RNA‐seq analysis: a tutorial"- it's a bit outdated, but still a good reference.
By adequate I mean the clusters are the same but some are split into two, which makes sens looking at other results (like transcription factor analysis).
The number of (or size of) clusters should not be used to interpret how good the clustering methodology is, since it is generally dependant on the input parameters, e.g. a higher resolution parameter leads to more clusters. Instead, display the clusters on the UMAP and see if they are continuous 'visually' and check what genes are differentially expressed between clusters and see if they make sense 'biologically'.
I agree that there ara lot of developments happening fast (and as a matter of fact that Leiden works better than louvain). However, I think that the main points made by the paper, like the scaling question or how to normalize data are far more enduring and not addressed by any recent development.More
Since we both cited the same paper in our answers, do you think that a paper from 2019 can be called "outdated"? What new developments are not part of this overview?More
Regarding the clustering evaluation bit above, there is plethora of metrics. I always keep an eye on the "average silhouette width", "adjusted rand index" (using SingleR annotations as labels) and also "clustering trees (easily obtained with More
Upvote
VOTE
Downvote
more replies
There is discussion if scaling the data (making the data range for all genes the same) is something you need for single cell data. The argument is that the expression differences between genes themselves are informative. Normalization on the other hand is always necessary.
The big single cell pipelines like Seurat or Monocle use both normalization and scaling as standard.
If you would like some of the clusters you get split into subclusters you could either increase the resolution parameter that the clustering functions usually have. Or you can take the cells from a cluster, then subcluster them and add the subclusters to the original clustering results.
For yor next question it would be great if you could provide the plots of the data because this way it is easier to understand what the problem is.
There is discussion if scaling the data (making the data range for all genes the same) is something you need for single cell data. The argument is that the expression differences between genes themselves are informative. Normalization on the other hand is always necessary. The big single cell pipelines like Seurat or Monocle use both normalization and scaling as standard.
If you would like some of the clusters you get split into subclusters you could either increase the resolution parameter that the clustering functions usually have. Or you can take the cells from a cluster, then subcluster them and add the subclusters to the original clustering results.
For yor next question it would be great if you could provide the plots of the data because this way it is easier to understand what the problem is.
If you working on known cell culture, I recommend using classification approach instead of clustering. One library that I used to publish my paper is SingleR. I checked the expression x cell type matrix by both approaches (Seurat Clustering and SingleR), the classification approach make much more sense.
If you working on known cell culture, I recommend using classification approach instead of clustering. One library that I used to publish my paper is SingleR. I checked the expression x cell type matrix by both approaches (Seurat Clustering and SingleR), the classification approach make much more sense.



Typically people run PCA, UMAP and Louvain clustering on the normalised and log-transformed expression counts (but do marker gene and differential expression analysis on the non-normalised values). However, this remains controversial. I recommend reading "Current best practices in single‐cell RNA‐seq analysis: a tutorial"- it's a bit outdated, but still a good reference.
The number of (or size of) clusters should not be used to interpret how good the clustering methodology is, since it is generally dependant on the input parameters, e.g. a higher resolution parameter leads to more clusters. Instead, display the clusters on the UMAP and see if they are continuous 'visually' and check what genes are differentially expressed between clusters and see if they make sense 'biologically'.
Typically people run PCA, UMAP and Louvain clustering on the normalised and log-transformed expression counts (but do marker gene and differential expression analysis on the non-normalised values). However, this remains controversial. I recommend reading "Current best practices in single‐cell RNA‐seq analysis: a tutorial"- it's a bit outdated, but still a good reference.
The number of (or size of) clusters should not be used to interpret how good the clustering methodology is, since it is generally dependant on the input parameters, e.g. a higher resolution parameter leads to more clusters. Instead, display the clusters on the UMAP and see if they are continuous 'visually' and check what genes are differentially expressed between clusters and see if they make sense 'biologically'.
More
VOTE
VOTE
VOTE
VOTE
VOTE
VOTE
There is discussion if scaling the data (making the data range for all genes the same) is something you need for single cell data. The argument is that the expression differences between genes themselves are informative. Normalization on the other hand is always necessary.
The big single cell pipelines like
SeuratorMonocleuse both normalization and scaling as standard.If you would like some of the clusters you get split into subclusters you could either increase the resolution parameter that the clustering functions usually have. Or you can take the cells from a cluster, then subcluster them and add the subclusters to the original clustering results.
For yor next question it would be great if you could provide the plots of the data because this way it is easier to understand what the problem is.
There is discussion if scaling the data (making the data range for all genes the same) is something you need for single cell data. The argument is that the expression differences between genes themselves are informative. Normalization on the other hand is always necessary.
The big single cell pipelines like
SeuratorMonocleuse both normalization and scaling as standard.If you would like some of the clusters you get split into subclusters you could either increase the resolution parameter that the clustering functions usually have. Or you can take the cells from a cluster, then subcluster them and add the subclusters to the original clustering results.
For yor next question it would be great if you could provide the plots of the data because this way it is easier to understand what the problem is.
More
VOTE
If you working on known cell culture, I recommend using classification approach instead of clustering. One library that I used to publish my paper is SingleR. I checked the expression x cell type matrix by both approaches (Seurat Clustering and SingleR), the classification approach make much more sense.
If you working on known cell culture, I recommend using classification approach instead of clustering. One library that I used to publish my paper is SingleR. I checked the expression x cell type matrix by both approaches (Seurat Clustering and SingleR), the classification approach make much more sense.
More
VOTE