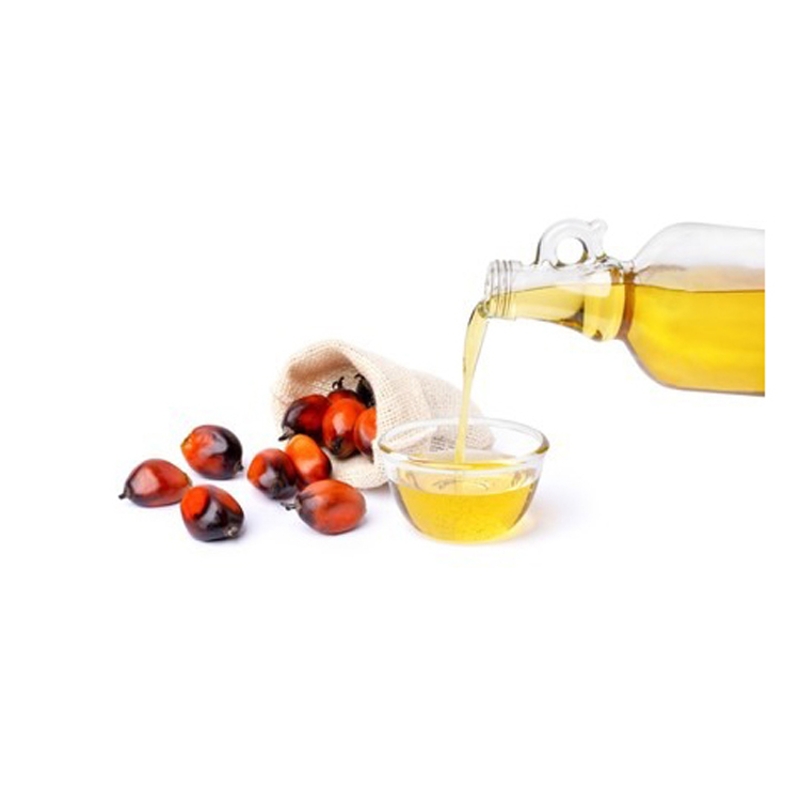
November 12th, it was reported that
1. Mean Difference Change Table
| Moving Average Type | Value on 2026.11.11 | Value on 2026.11.10 | Direction of Change |
|---|---|---|---|
| 5-Day Moving Average (D5) | 92.40 | -146.80 | + |
| 10-Day Moving Average (D10) | -146.20 | -202.00 | + |
| 20-Day Moving Average (D20) | -217.10 | -202.20 | - |
2. Signal Status Judgment
Strong rebound (bullish bias, rebound nature)
3. Trend Direction Conclusion
The current price trend of palm oil is fluctuating (with a bias towards a rebound), due to the fact that the change in the difference between the 5-day, 10-day, and 20-day averages from the previous day is not completely consistent, which meets the criteria for fluctuation. The specific symbol combination is (+, +, -), corresponding to a strong rebound with a bias towards an increase in the fluctuation type.
4. Positional Spatial Reference
- 3-month cycle: Price is in the first tier (low level), with limited downside potential.
- 60-day cycle: Price is in the second tier (mid-to-low range) 1 year cycle: The price is in the 2nd tier (lower middle), with no obvious restrictions on upward potential.
5. Trend Chart Display
Risk Warning The above analysis is for reference only and does not constitute trading advice.