November 13th, according to reports
1. Average Difference Change Table
| Mean Difference Indicator | Today's Value (2026.11.12) | Yesterday's Value (2026.11.11) | Direction of Change |
|---|---|---|---|
| 5-Day Mean Difference | -66.66 | 0.00 | - |
| 10-Day Mean Difference | -8.34 | 0.00 | - |
| 20-Day Mean Difference | 196.67 | 235.00 | - |
2. Signal Status Determination
Clear Downtrend signal
3. Trend Direction Conclusion
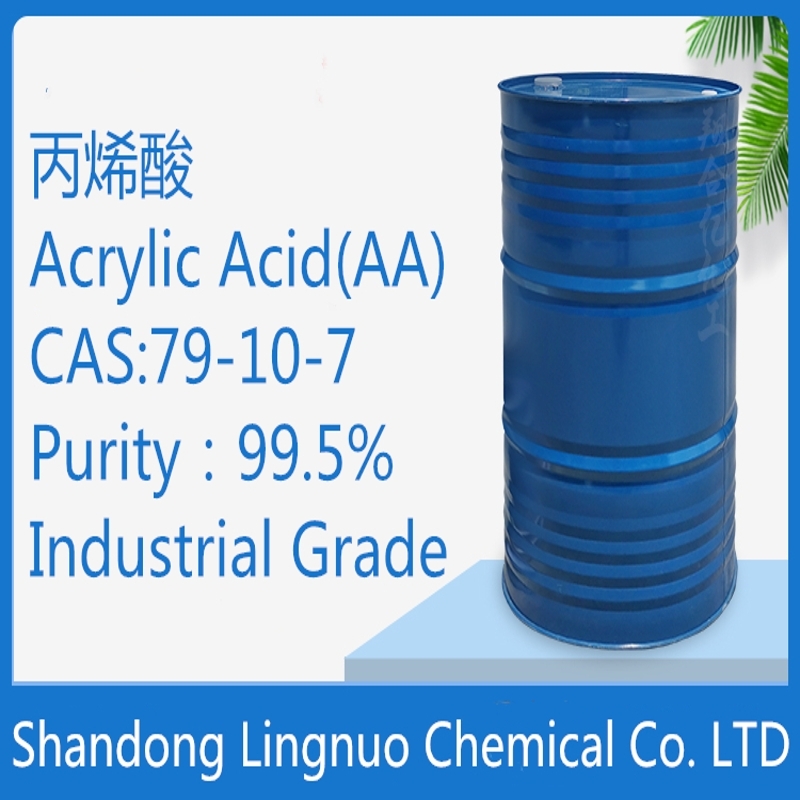
The current Acrylic Acid price trend is a clear downtrend. Reason: The direction of change in the 5-day, 10-day, and 20-day differences is entirely consistent with that of the previous day, all showing negative movement, which conforms to the Clear Downtrend criteria of the difference method.
4. Position and Spatial Reference
Based on the price range over the past 60 days and three months, the current acrylic acid price is in the fifth decile (the highest 20% of the period, at a high level), suggesting limited room for further increases; based on the one-year price range, it is in the third decile (around the median), indicating a relatively reasonable valuation.
5. Trend Chart Display
Risk Warning
The above analysis is for reference only and does not constitute trading advice.