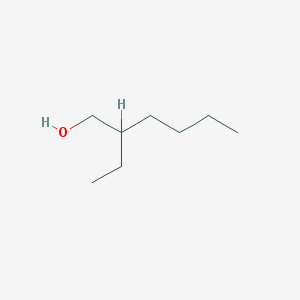

This issue of the daily spot market report for 2-ethylhexanol is based on a mean difference analysis framework, combining the latest spot quotations, moving average data, and cyclical position analysis as of November 2, 2026. The current short-term trend for 2-ethylhexanol in China shows a strong consolidation (bullish) pattern, with prices at high levels across multiple timeframes including 60 days, 3 months, and 1 year. The potential for further price increases is relatively limited. Stakeholders along the supply chain are advised to adjust their production and procurement plans according to actual supply and demand dynamics. The latest available data is up to November 2, 2026, and it is recommended to refer to real-time data for the most accurate information.
1. Mean Deviation Change Table
| Type of Mean Difference | Value on November 2, 2026 | Value on November 1, 2026 | Direction of Change |
|---|---|---|---|
| 5-Day Mean Difference (D5) | 140 | 173.33 | - |
| 10-Day Mean Difference (D10) | 268.34 | 255 | + |
| 20-Day Mean Difference (D20) | 245.83 | 209.17 | + |
2. Signal Status Determination
The current mean difference change combination is (-, +, +), which is a strong consolidation (bullish) signal.
3. Trend Direction Conclusion
The short-term trend is choppy (leaning bullish), for the following reason: the direction of change in the 5-day, 10-day, and 20-day moving averages is not entirely consistent with the previous day, meeting the criteria for a choppy trend; the corresponding sign combination is (-, +, +), indicating a strong consolidation phase, with an overall bullish bias. From a fundamental perspective, upstream propylene has been trading strongly recently, while downstream demand for plasticizers such as DOP and DOTP remains well supported, providing some price floor support.
4. Position Space Reference
The current price of 2-ethylhexanol is in the top 20% range for the 60-day, 3-month, and 1-year periods, placing it in the 5th tier (high). According to the 5-tier rule, there is limited room for further price increases in the high tier.
5. 1-Year Trend Chart Display
6. Risk Warning
The above analysis is for reference only and does not constitute trading advice.
(Source: )