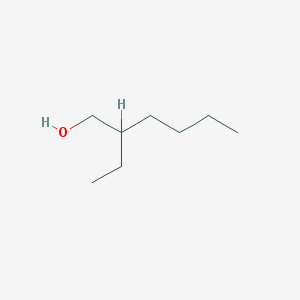

This analysis, based on the mean deviation method and focusing on the spot price of 2‑ethylhexanol as of November 3, 2026, indicates that the current mean deviation signal for 2‑ethylhexanol points to strong consolidation (slightly bullish). Prices are near the high end of the one-year cycle, leaving limited room for further gains. In the short term, the market is expected to trade in a generally firm but volatile range. The following section provides a detailed breakdown:
I. Table of Finite Differences
| Mean Difference Indicator | Value on 2026.11.03 | Value on 2026.11.02 | Direction of Change |
|---|---|---|---|
| 5-Day Mean Difference (D5) | -13.33 | 140 | - |
| 10-Day Mean Difference (D10) | 275 | 268.34 | + |
| 20-Day Mean Difference (D20) | 282.5 | 245.83 | + |
II. Signal State Determination
The current mean difference change combination is (-, +, +), which aligns with the strong consolidation (bullish) signal in the rules.
III. Conclusion on Trend Direction
The current price trend of 2-ethylhexanol is judged to be fluctuating (with a bullish bias). The reason is that the changes in the 5-day, 10-day, and 20-day moving averages compared to the previous day are not entirely consistent, and do not meet the conditions for a clear upward or downward trend. Therefore, the overall trend is fluctuating. Additionally, with a strong consolidation (bullish) signal, the short-term fluctuation shows stronger bullish momentum.
IV. Position Space Reference
Isobutanol has been in the 5th (highest) tier of the 5-tier price range over the past 60 days, 3 months, and 1 year in China. According to the rules, its potential for further increase is limited.
V. Trend Chart of 2-Ethylhexanol Over the Past Year
VI. Data Explanation
The latest available data is up to November 3, 2026. It is recommended to refer to real-time data.
VII. Risk Warning
The above analysis is for reference only and does not constitute trading advice.
(Source: )