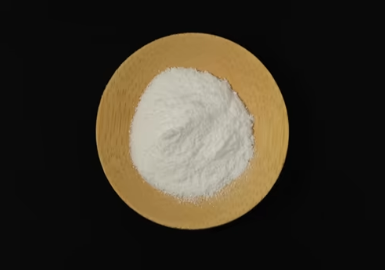
The latest available data for heavy soda ash in China is up to September 22, 2026. It is recommended to refer to real-time data.
1. Mean Difference Change Table
| Average Difference Indicator | Today’s Value (2026.09.22) | Yesterday’s Value (2026.09.21) | Direction of Change |
|---|---|---|---|
| 5-Day Average Difference | 0.00 | 0.00 | Flat |
| 10-Day Average Difference | -4.14 | -5.43 | Upward |
| 20-Day Average Difference | -3.50 | -2.71 | Downward |
2. Signal Status Determination
The current signal is a "rebound (with a bearish bias)" within the oscillation range (symbol combination is flat, +, -, with short-term and medium-term trends diverging).
3. Trend Direction Conclusion
The short-term trend is oscillating, with no clear unilateral direction. Reason: The changes in the 5-day, 10-day, and 20-day averages do not consistently follow the same direction as the previous day, which meets the criteria for a volatile market under the average difference method. From a fundamental perspective, the current spot price of heavy soda ash has remained flat for two consecutive days, and there are no significant positive or negative drivers in the supply and demand of the upstream and downstream markets. Trading activity in the market is relatively low.
4. Location and Spatial Reference
Heavy soda ash 60-day, 3-month, and 1-year cycle prices are all in the 1st tier (low position), with limited room for decline.
5. Industry Chain Reference
- Upstream related products: industrial salt, raw salt
- Downstream related products: compound alkali, anhydrous sodium acetate, sodium thiosulfate, anhydrous calcium chloride, glass, alumina, sodium bicarbonate, etc.
6. Trend Chart Display
Risk Warning
The above analysis is for reference only and does not constitute trading advice.