How did the European chemical industry give birth to giants such as BASF/Evonik?
Europe is the second largest chemical producer in the world

In 2009, China became the world's largest chemical producer, accounting for 23.6% of global chemical sales for the first time; followed by the European Union, accounting for 23.4% of global sales. China has been increasing its market share since 2009.
In 2018, the world's chemical turnover was 3,347 billion euros. Global sales increased by 2.5% from 3.266 billion euros in 2017 to 3.347 billion euros in 2018. In 2018, China's chemical product output was 1.198 billion euros, and it remains the world's largest chemical producer, accounting for 35.8% of global chemical sales in 2018.
The EU chemical industry accounted for 16.9% of total sales, and the United States accounted for 14%. In the past decade, global competition has changed significantly, as emerging Asian countries now maintain the top sales charts.
In 2018, three-quarters of global chemical product sales came from the BRIC countries, the European Union and the United States, and the remaining chemical sales mainly came from emerging Asian countries, including the Middle East.
Top ten chemical producers in the world

In 2018, the total turnover of the top ten chemical producing countries was 2,901 billion euros, accounting for 86.7% of global chemical sales.
Among the top ten producing countries, six countries or regions in Asia (China, Japan, South Korea, India, Taiwan, and Saudi Arabia) have chemical sales of 1,886 billion euros, accounting for 51.5% of the world market. China’s sales level is higher than the EU and US markets combined (1,198 billion euros, compared with 565 billion euros + 468 billion euros in the same period last year).
Two of the top ten are European producers (EU28 + Russia), generating sales revenue of 640.5 billion euros (19.1%). From 2017 to 2018, European chemical sales increased by 2.8%. In 2018, sales revenue in most European countries/regions increased.
Two of the top ten countries/regions are American producers (the United States and Brazil) with chemical sales of 537.6 billion euros (16.1%). Compared with 2017, the sales revenue of the US chemical industry in 2018 increased by less than 1%. Business development in Brazil did not improve in 2018, and sales revenue declined.
Although the EU has lost its leading position in sales, it is still at the forefront of the world

Sales in the European Union have been growing, and the overall growth rate of global chemical sales has exceeded this growth rate. In 2018, China's sales share in the world chemical market increased to 35.8%, making it the world's largest chemical producer.
The EU has gradually lost its leading position in chemical sales in China and other parts of Asia (excluding Japan). The EU’s contribution to world chemical sales dropped by 9.6 percentage points from 26.5% in 2008 to 16.9% in 2018.
The EU chemical industry is still at the forefront of the world and is in a leading position in technological innovation. In the coming decades, the challenge for the EU is to remain competitive. Take advantage of opportunities in emerging markets to enhance the global status of EU chemicals.
The relative share of EU chemical sales in the global market halved
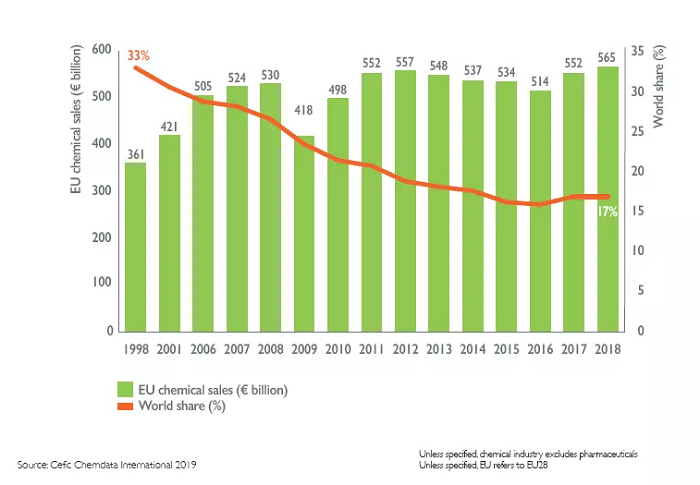
In 2018, global chemical sales tripled compared to 20 years ago. Since 1998, global chemical sales have continued to grow, and sales have tripled in 2018 (1,097 billion euros to 3.347 billion euros)
In 1998, the European Union reported sales of 361 billion euros, accounting for 32.9% of world chemical sales. Since then, chemical sales have continued to grow, and the value has expanded by nearly 50%. Due to the rapid growth of the global chemical market, the relative share of the EU chemical market has almost halved in 20 years, from 32.9% to 16.9%.
This is a future development trend. Data analysis shows that the demand for chemicals in China and other emerging countries is growing strongly, while the demand for most European chemicals-Europe and North America-is in a state of low growth.
The overall growth in chemical demand and production, as well as the rapid growth in emerging regions is a continuing future trend. Growth in Europe remains low, mainly due to mature markets and an aging population. The EU's trade surplus remains high.
In addition to increased competition from other regions, there are other potential reasons for this relative decline, including relatively high energy prices, lagging innovation, currency appreciation, high labor costs, regulatory and tax burdens. Sectoral R&D intensity, energy prices, and exchange rates have a strong quantitative relationship with competitiveness.
Petrochemicals and specialty chemicals account for half of EU chemical sales

The output of the EU chemical industry covers three major product areas: basic chemicals, specialty chemicals and consumer chemicals. Basic chemicals, covering petrochemical products and their derivatives and basic inorganic substances. They are mass produced and sold in the chemical industry or other industries.
In 2018, basic chemicals accounted for 60.4% of total EU chemical sales. The inorganic basic chemicals sub-sector includes the production of the following chemicals, inorganic acids (such as sulfuric acid), alkalis (such as caustic soda) and other inorganic compounds (such as chlorine); the petrochemical product sub-sector uses basic processes (such as thermal cracking) And distillation) to make chemicals. In most cases, the primary form of polymer is integrated into petrochemical products. The primary form of plastic includes the manufacture of resins, plastic materials and elastomers.
Specialty chemicals cover the fields of paints, inks, crop protection, dyes and pigments. The production volume of specialty chemicals is small, but still accounted for 27.2% of EU chemical sales in 2018.
Consumer chemicals are sold to end consumers, such as soaps, detergents, perfumes and cosmetics, which accounted for 12.4% of total EU chemical sales in 2018. Petrochemical products and specialty chemicals accounted for 52.6%.
The total sales of chemicals in the 7 EU countries account for more than 80%

Germany and France are the two largest chemical producers in Europe, followed by Italy and the Netherlands. These four countries accounted for 63.3% of EU chemical sales in 2018, valued at 357.7 billion euros. Including Spain, Belgium and the United Kingdom, this share rose to 83.6%, or 472.1 billion euros. The remaining EU member states accounted for 16.4% of EU chemical sales in 2018, with Poland and Austria being the two largest contributors.
UK chemical sales reached an average of 38.6 billion euros (2010-2018); EU27 chemical exports to the UK reached 23.4 billion euros, while imports from the UK totaled 20.3 billion euros. The UK accounts for 7.2% of EU28 chemical sales, and more than half of the UK’s chemical production is exported to EU27 (52.5%). Britain’s withdrawal from the European Union has brought political and economic challenges.
Internal market drives EU chemical sales
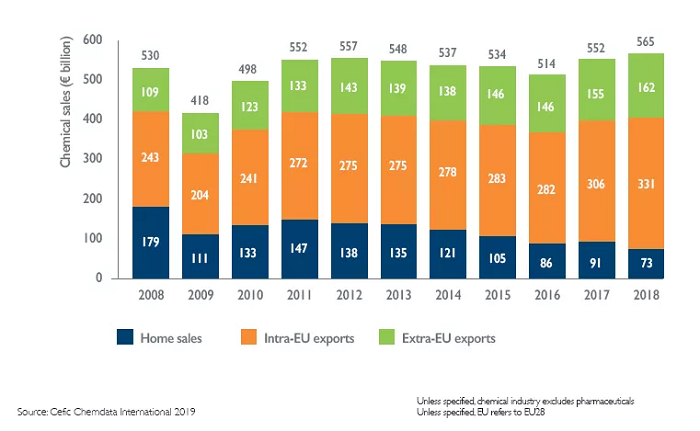
EU chemical sales include three categories: domestic sales, EU internal sales and EU external exports.
This chart shows the sharp decline in overall EU chemical sales during the 2009 recession. The industry has suffered the spillover effects of the economic and financial crisis. In 2009, sales lost more than one-fifth. 2010 was a year of recovery, and the chemicals sector gradually improved. Sales in 2017 were the highest level since 2013.
Local sales: They represent the revenue of chemicals sold by EU chemical companies to the domestic market (for example, French companies sell their chemical products in France). Between 2008 and 2018, the local sales of EU chemicals fell by an average of 8.6% per year. Local sales dropped from 178 billion euros in 2008 to 73 billion euros in 2018.
Sales within the EU: They cover the revenues from chemicals that EU chemical companies sell in the EU single market but do not enter their domestic markets (for example, French companies sell their chemicals in Belgium or Germany).
Eliminating trade and non-trade barriers within the EU through the single market will help promote the growth and competitiveness of the EU chemical industry and increase the number of chemical transportation businesses within the EU. Intra-EU sales (marked as "Intra-EU exports" in the picture) climbed from 243 billion euros in 2008 to 331 billion euros in 2018.
EU exports: The European chemical industry is an export industry, and 29% of its output is exported outside the EU. Between 2008 and 2018, EU chemical exports outside the EU single market grew by an average of 4.1% per year. The chemical industry needs to continue to maintain global competitiveness in order to maintain its existing production capacity and grow in accordance with global demand.
More than 155 billion euros in EU sales come from outside the EU

Local sales: In 2018, 13% of chemical sales revenue came from the EU domestic market.
Sales within the EU: Although "local sales" are declining, the importance of sales within the EU is increasing. By 2018, EU internal sales (excluding domestic revenue) accounted for 58% of total EU chemical sales, up from 46% in 2008. Between 2008 and 2018, sales within the EU grew by an average of 3.1% per year.
EU exports: In 2018, 29% of chemical sales revenue came from non-EU chemical markets (exports), up from 20% in 2008. The three main markets for EU chemical exports are Asia, the EU's neighboring countries and the North American Free Trade Area.
Nearly two thirds of EU chemicals are supplied to industry
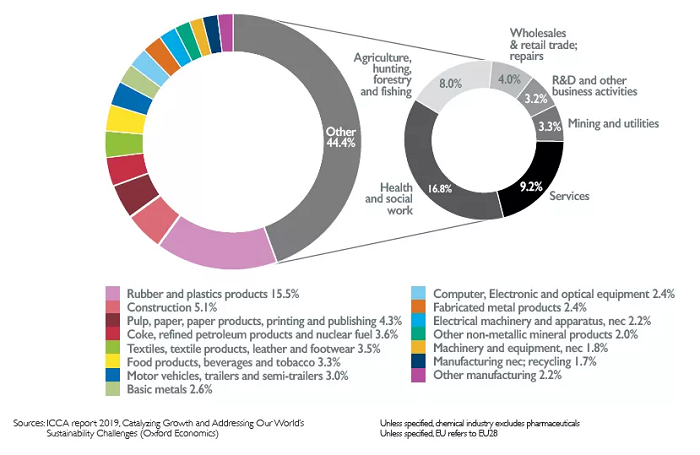
The chemical industry supplies almost the entire economic sector, and its strategy directly affects downstream chemical users. The main industrial users of chemicals are the rubber and plastics, construction, pulp and paper, and automotive industries.
Nearly two-thirds of EU chemicals are supplied to the industrial sector of the EU, including the construction industry. More than a third of the chemicals flow to other economic sectors in the EU, such as agriculture, services and other business activities.
The chemical industry’s contribution to the EU’s gross domestic product (GDP) is 1.1%. This ratio may seem small, but considering the shrinking manufacturing industry in many advanced economies and the increase in service industry output, it should be reassessed.

You May Interested In


High Quality β-Nicotinamide adenine dinucleotide CAS 53-84-9 NADwith ready stock and best price
$3/UNIT FOB


2026-10-16
Trade Alert
Delivering the latest product trends and industry news straight to your inbox.
(We'll never share your email address with a third-party.)

Related News
-
EC publishes EU chemicals sustainability strategy
-
Japanese Plastics Market Accelerates its Shifts to Recycled Materials and Bioplastics
-
Japan Begins Construction of the World’s Largest Commercial Liquid Hydrogen Receiving Terminal
-
Crude Tanker Freight From the Americas to Asia Tops $80 Million per Voyage Amid Global Shipping Crunch
-
India Swings the Tariff Axe at Made-in-China: Epoxy Resins Are Just the Beginning—The Road for Chinese Chemicals Abroad Is No Longer Smooth
-
Behind Arkema’s ¥430 Million Claim: A Patent War Over Acrylic Acid Is Tearing Off the “Technical Fig Leaf” of China’s Chemical Giants
-
Chemicals Take the Hit as China's Markets Thin Out — Wanhua, Juhua Chemical Slide Over 2%
-
Wacker Under Global Cost Pressure: Dual-Track Restructuring Through Layoffs, Consolidation, and Strategic Repositioning
-
From Coffee Waste to Superfood Additive: EU Declares Pectin-Rich Arabica Extract Safe for Food Use
-
Australia Approves Lab-Grown “Milk Sugar” for Babies—A Breakthrough in Infant Nutrition
Recommend Reading
-
![Korea Unlocks Additive Flexibility: New Rules Broaden Food Ingredient Horizons]()
Korea Unlocks Additive Flexibility: New Rules Broaden Food Ingredient Horizons
-
![Japan Tightens Tap: Pesticide Limits in Drinking Water Get a Safety Overhaul]()
Japan Tightens Tap: Pesticide Limits in Drinking Water Get a Safety Overhaul
-
![Uganda Sets Sugar Standards: East African Drafts Define Sweetness and Safety]()
Uganda Sets Sugar Standards: East African Drafts Define Sweetness and Safety
-
![Thailand Clears the Path for Vitamin Use: Streamlined Approval for Supplements]()
Thailand Clears the Path for Vitamin Use: Streamlined Approval for Supplements
-
![Canada Caffeinates Candy—With Warnings Attached]()
Canada Caffeinates Candy—With Warnings Attached
-
![Business Society October 14, 2026 Styrene Trend Analysis: Volatile and Bearish]()
Business Society October 14, 2026 Styrene Trend Analysis: Volatile and Bearish
-
![Business Society October 14, 2026 Ethyl Acetate Trend Analysis: Strong Consolidation]()
Business Society October 14, 2026 Ethyl Acetate Trend Analysis: Strong Consolidation
-
![Business Society October 14, 2026 Melamine Trend Analysis: Clear Decline]()
Business Society October 14, 2026 Melamine Trend Analysis: Clear Decline
-
![Business Society October 14, 2026 Ethanol Trend Analysis: Strong Consolidation]()
Business Society October 14, 2026 Ethanol Trend Analysis: Strong Consolidation
-
![Business Society October 13, 2026 Ethanol Trend Analysis: Strong Consolidation]()
Business Society October 13, 2026 Ethanol Trend Analysis: Strong Consolidation