China imported 320 million tons of crude oil in July, an increase of 12.1%
According to data released by the General Administration of Customs on August 7th, in the first seven months of this year, China’s total import and export value of goods trade was 17.16 trillion yuan, a decrease of 1.7% from the same period last year (the same below), and the rate of decrease was 1.5 times smaller than the first half of the year. percentage point. Among them, exports were 9.4 trillion yuan, down 0.9%; imports were 7.76 trillion yuan, down 2.6%; the trade surplus was 1.64 trillion yuan, an increase of 8.1%.
In July, China's foreign trade imports and exports reached 2.93 trillion yuan, an increase of 6.5%. Among them, exports were 1.69 trillion yuan, an increase of 10.4%; imports were 1.24 trillion yuan, an increase of 1.6%; the trade surplus was 442.23 billion yuan, an increase of 45.9%.
The proportion of general trade import and export increased, and the import and export of bonded logistics increased. In the first seven months, China's general trade import and export was 10.35 trillion yuan, down 0.5%, accounting for 60.3% of China's total foreign trade value, an increase of 0.7 percentage point over the same period last year. Among them, exports were 5.59 trillion yuan, an increase of 0.6%; imports were 4.76 trillion yuan, a decrease of 1.9%. In the same period, the import and export of processing trade was 4.03 trillion yuan, a decrease of 7.1%. Among them, exports were 2.55 trillion yuan, down 7.7%; imports were 1.48 trillion yuan, down 6.1%. In addition, China imported 2.07 trillion yuan in bonded logistics, an increase of 2.9%. Among them, exports were 700.27 billion yuan, an increase of 5.3%; imports were 1.37 trillion yuan, an increase of 1.7%.
Imports and exports to ASEAN, the European Union and Japan increased, while imports to the United States declined. In the first seven months, the total value of China's trade with ASEAN was 2.51 trillion yuan, an increase of 6.6%, accounting for 14.6% of China's total foreign trade value. Among them, China's exports to ASEAN were 1.4 trillion yuan, an increase of 5.6%; imports from ASEAN were 1.11 trillion yuan, an increase of 7.8%; the trade surplus with ASEAN was 288.13 billion yuan, a decrease of 2.1%. The total value of China's trade with the EU was 2.41 trillion yuan, an increase of 0.1%, accounting for 14% of China's total foreign trade value. Among them, China’s exports to the EU were 1.47 trillion yuan, an increase of 4%; imports from the EU were 936.72 billion yuan, a decrease of 5.6%; and the trade surplus with the EU was 534.78 billion yuan, an increase of 26.5%. The total value of Sino-US trade was 2.03 trillion yuan, down 3.3%, accounting for 11.8% of our total foreign trade value. Among them, China’s exports to the United States were 1.56 trillion yuan, a decrease of 4.1%; imports from the United States were 475.5 billion yuan, a decrease of 0.3%; and the trade surplus with the United States was 1.08 trillion yuan, a decrease of 5.7%. The total value of Sino-Japanese trade was 1.22 trillion yuan, an increase of 1.1%, accounting for 7.1% of our total foreign trade value. Among them, exports to Japan were 557.13 billion yuan, an increase of 0.2%; imports from Japan were 666.85 billion yuan, an increase of 1.8%; the trade deficit with Japan was 109.72 billion yuan, an increase of 10.8%.
The import and export of private enterprises increased and their proportion increased. In the first seven months, the import and export of private enterprises was 7.83 trillion yuan, an increase of 7.2%, accounting for 45.6% of China's total foreign trade value, an increase of 3.8 percentage points over the same period last year. Among them, exports were 5.12 trillion yuan, an increase of 6.4%, and accounted for 54.5% of the total export value; imports were 2.71 trillion yuan, an increase of 8.7%, and accounted for 34.9% of the total import value. In the same period, the import and export of foreign-invested enterprises was 6.65 trillion yuan, down 5%, accounting for 38.8% of our total foreign trade value. Among them, exports were 3.43 trillion yuan, down 7.7%; imports were 3.22 trillion yuan, down 2.1%. In addition, the import and export of state-owned enterprises was 2.62 trillion yuan, down 13.9%, accounting for 15.2% of China's total foreign trade value. Among them, exports were 824.05 billion yuan, down 10.9%; imports were 1.79 trillion yuan, down 15.2%.
Exports of mechanical and electrical products, textiles and plastic products increased, while exports of clothing declined. In the first seven months, China exported 5.5 trillion yuan of mechanical and electrical products, an increase of 0.2%, accounting for 58.5% of the total export value. Among them, the export of automatic data processing equipment and its parts was 770.7 billion yuan, an increase of 6%; mobile phones were 419.54 billion yuan, an increase of 6.5%. In the same period, exports of textiles, including masks, were 634.32 billion yuan, an increase of 35.8%; clothing was 467.6 billion yuan, a decrease of 13.8%; plastic products were 298.9 billion yuan, an increase of 11.5%; furniture was 196.82 billion yuan, a decrease of 2.6%; footwear was 128.22 billion yuan. , Down by 26.7%; toys, 99.5 billion yuan, down by 2.4%; and luggage, 76.6 billion yuan, down by 26.7%. In addition, 32.88 million tons of steel products were exported, a decrease of 17.6%; and 520,000 vehicles (including chassis) were exported, a decrease of 25.9%.
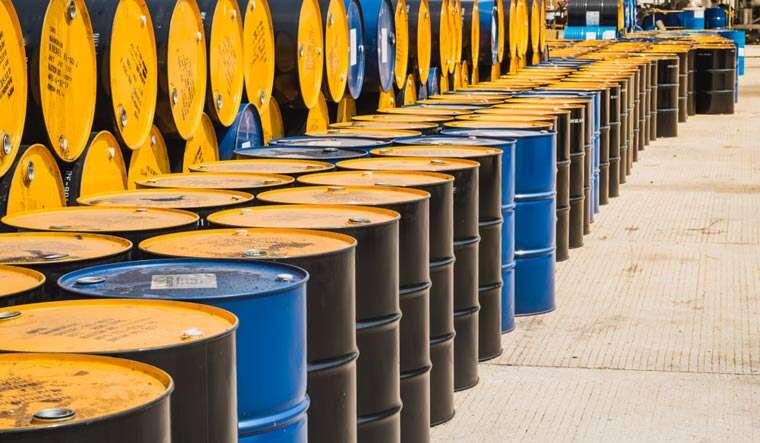
Imports of iron ore increased in volume and prices, while imports of crude oil, coal, natural gas, soybeans and other commodities increased in volume and prices fell. In the first seven months, China imported 660 million tons of iron ore, an increase of 11.8%, and the average import price was 641.2 yuan per ton, an increase of 1.1%; crude oil was 320 million tons, an increase of 12.1%, and the average import price was 2321.9 yuan per ton, a decrease. 29.7%; 200 million tons of coal, an increase of 6.8%, average import price of 495.4 yuan per ton, a decrease of 7.6%; natural gas 55.706 million tons, an increase of 1.9%, average import price of 2547.7 yuan per ton, a decrease of 15.6%; soybeans 55.135 million Tons, an increase of 17.7%, the average import price was 2729.6 yuan per ton, a decrease of 0.5%; the primary form of plastics was 22.719 million tons, an increase of 9%, and the average import price was 8,763 yuan per ton, a decrease of 13.2%; refined oil was 18.816 million tons, Increased by 2.2%, the average import price was 2884.8 yuan per ton, down by 23.5%; steel was 9.948 million tons, an increase of 49.3%, and the average import price was 6116.2 yuan per ton, down by 25.4%; unwrought copper and copper materials were 3.603 million tons, An increase of 34%, the average import price was 42,500 yuan per ton, down 6.3%. In addition, imports of mechanical and electrical products were 3.48 trillion yuan, an increase of 1.8%. Among them, integrated circuits were 289.16 billion, an increase of 24.8%, valued at 1.29 trillion yuan, an increase of 15.7%; 430,000 vehicles (including chassis), a decrease of 30.1%, were worth 142.8 billion yuan, a decrease of 25.4%.

You May Interested In


High Quality β-Nicotinamide adenine dinucleotide CAS 53-84-9 NADwith ready stock and best price
$3/UNIT FOB


2026-10-17
Trade Alert
Delivering the latest product trends and industry news straight to your inbox.
(We'll never share your email address with a third-party.)

Related News
-
The Truth Behind The Sharp Drop In International Oil Prices As Refined Oil Prices Are Cut
-
Crude Oil Trading Giant Vitol: Oil Prices May Stay Above $100 for a Long Time
-
Chinese Oil,gas firms to post better margins in second half
-
China's crude oil output up 2.4% in September
-
China Sept crude oil imports up 2.1% m/m as port congestion eases
-
China's crude oil output up 2.3% in August
-
Indian spice export data: China becomes the largest buyer!
-
China's crude production growth accelerates in August, natural gas slows down
-
China's August crude oil imports rise 13% y/y
-
Chinese Oil,gas firms to post better margins in second half
Recommend Reading
-
![Deméter Enters China with a Stress-Focused Pitch]()
Deméter Enters China with a Stress-Focused Pitch
-
![China’s TiO₂ Industry Launches Sixth Price Hike Wave as More Than 20 Producers Follow]()
China’s TiO₂ Industry Launches Sixth Price Hike Wave as More Than 20 Producers Follow
-
![Another Major Coating Manufacturer Acquired by a Central SOE: BNBM Acquires SUNROAD Group for Over RMB 300 Million, Locks in Three-Year Performance Pledge]()
Another Major Coating Manufacturer Acquired by a Central SOE: BNBM Acquires SUNROAD Group for Over RMB 300 Million, Locks in Three-Year Performance Pledge
-
![Middle East Conflict Hits China Seafood Trade]()
Middle East Conflict Hits China Seafood Trade
-
![Hormuz Closure Raises Cold-Chain Risk]()
Hormuz Closure Raises Cold-Chain Risk
-
![Soda ash prices in China rose first and then fell in October]()
Soda ash prices in China rose first and then fell in October
-
![Weak Demand Sends Acrylonitrile Market into Sharp Decline]()
Weak Demand Sends Acrylonitrile Market into Sharp Decline
-
![Business Society September 15, 2026 BDO Trend Analysis: Clearly Upward]()
Business Society September 15, 2026 BDO Trend Analysis: Clearly Upward
-
![BDO Market Conditions Remain Relatively Stable]()
BDO Market Conditions Remain Relatively Stable
-
![October Benzene Market Trend Summary (October 1, 2025 - October 31, 2025) in China]()
October Benzene Market Trend Summary (October 1, 2025 - October 31, 2025) in China